Basemap
Description of the Basemap
INTRODUCTION
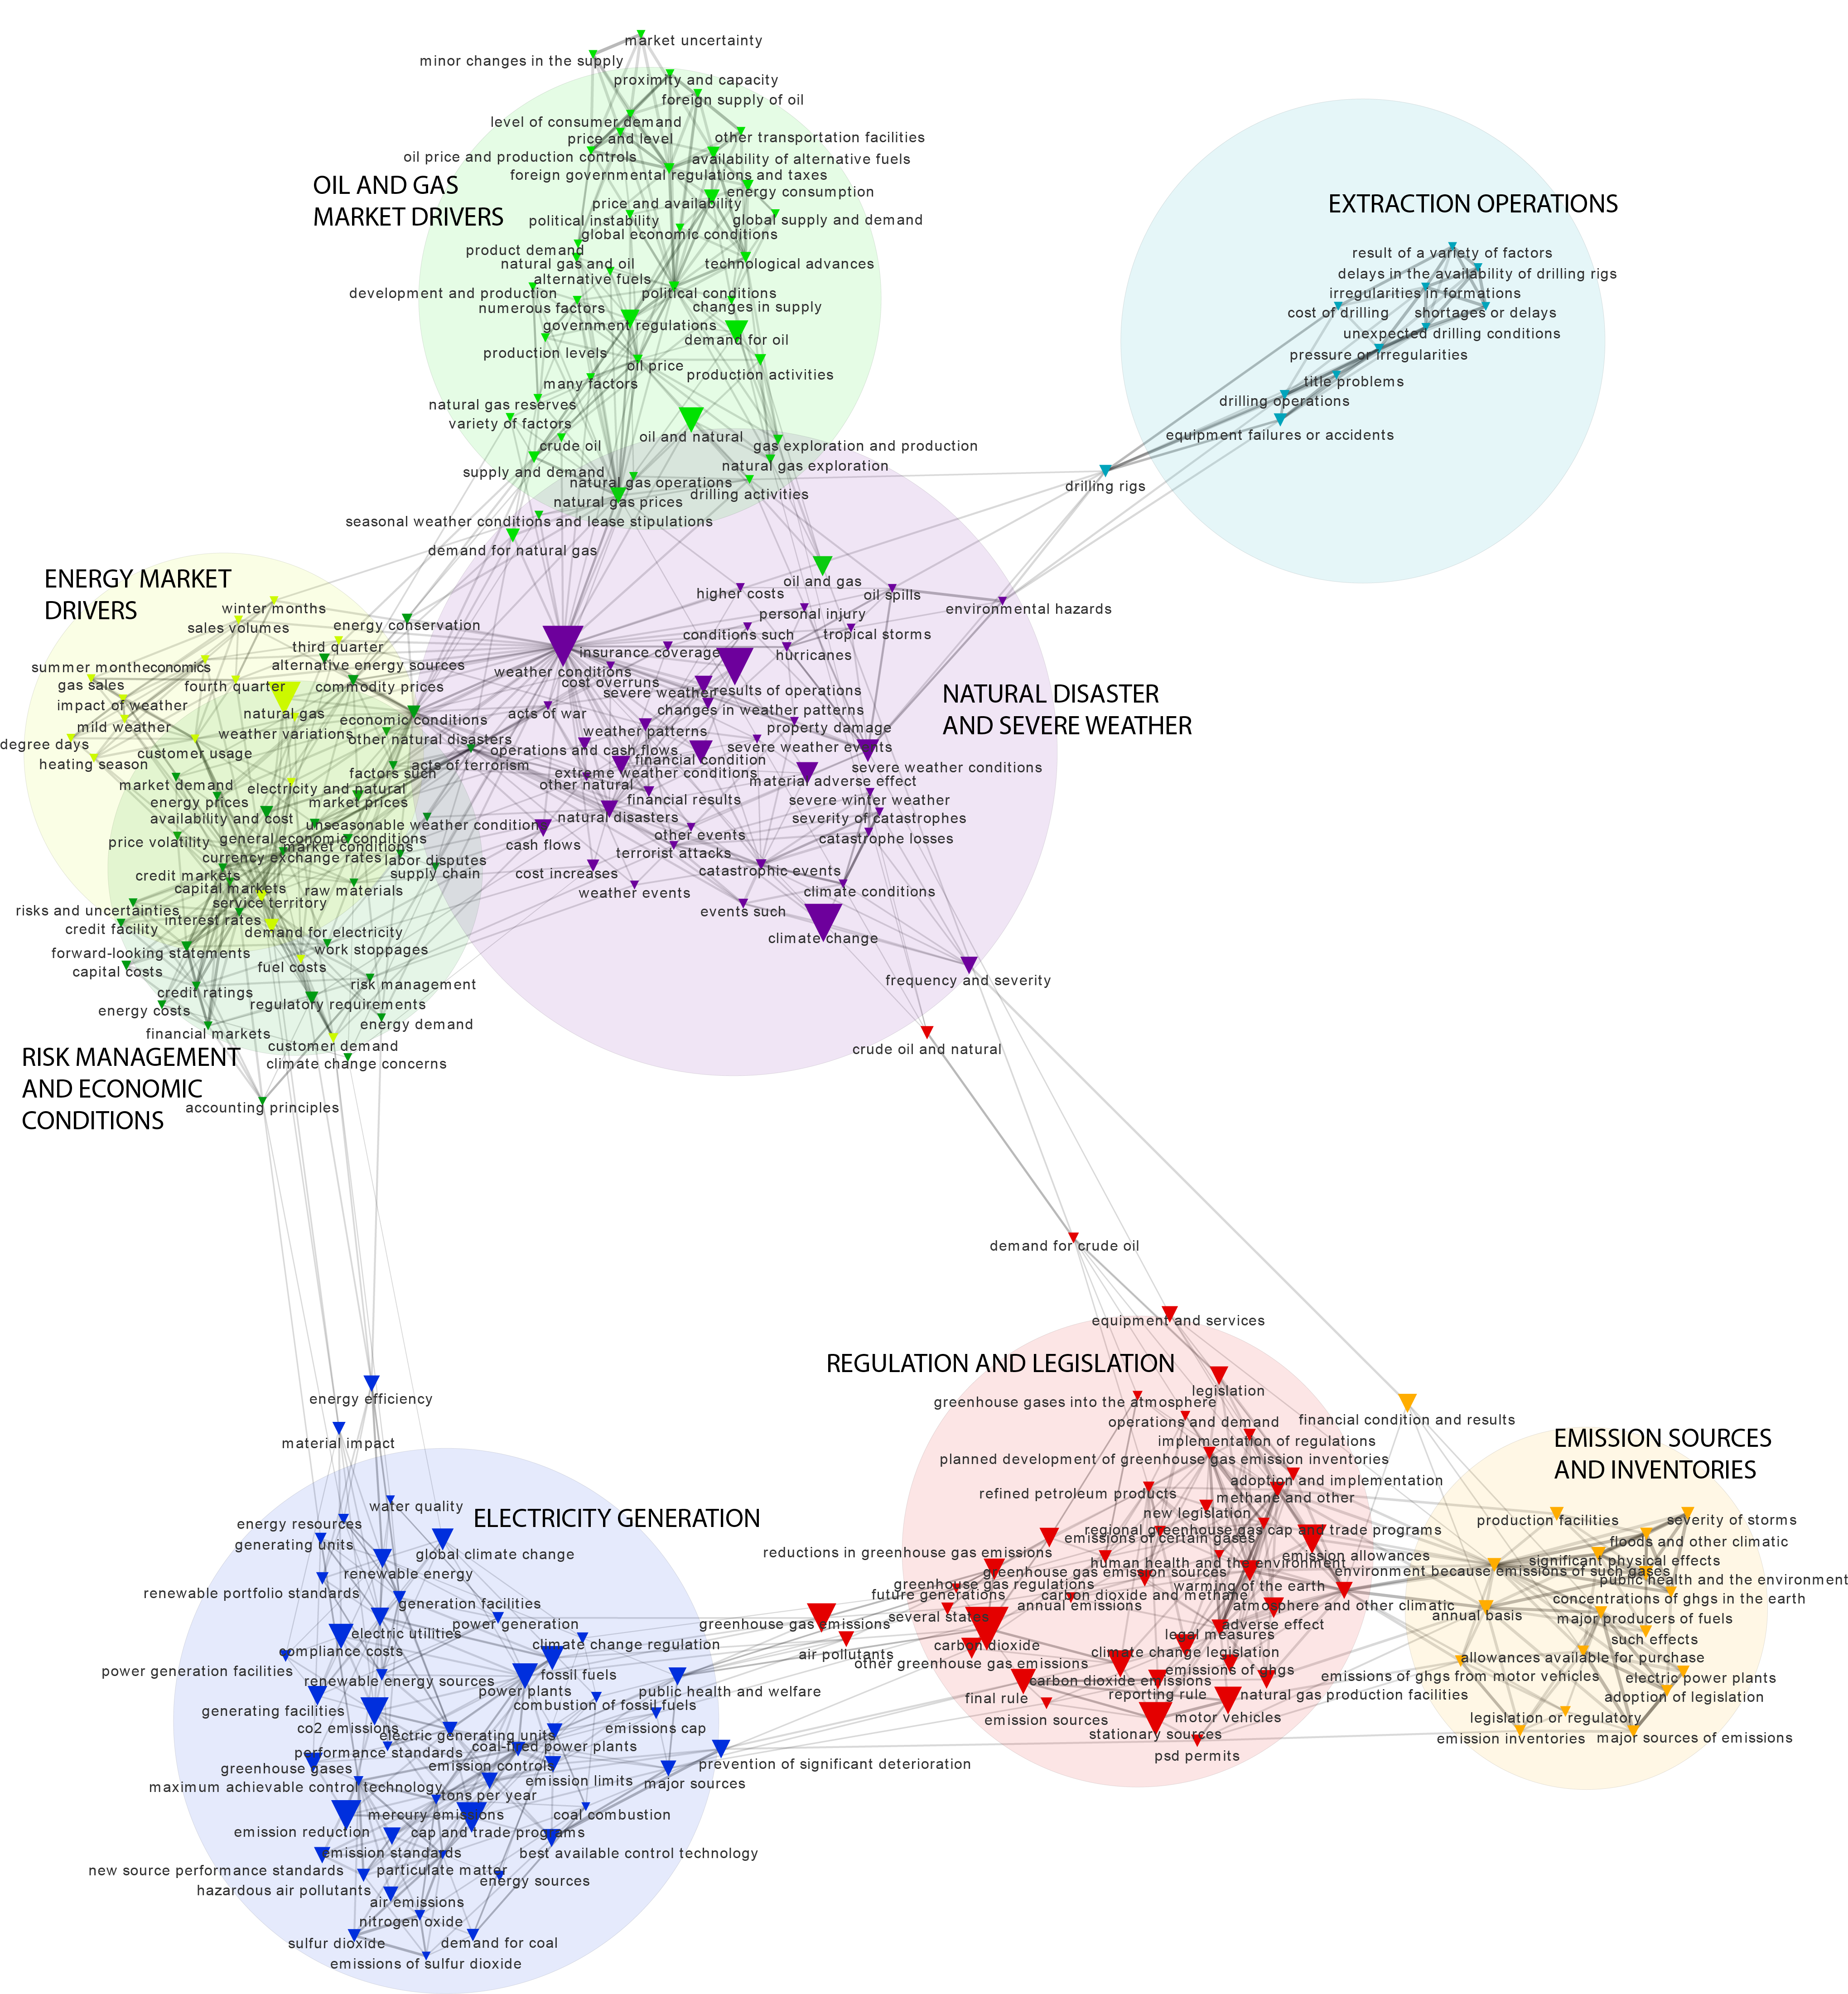
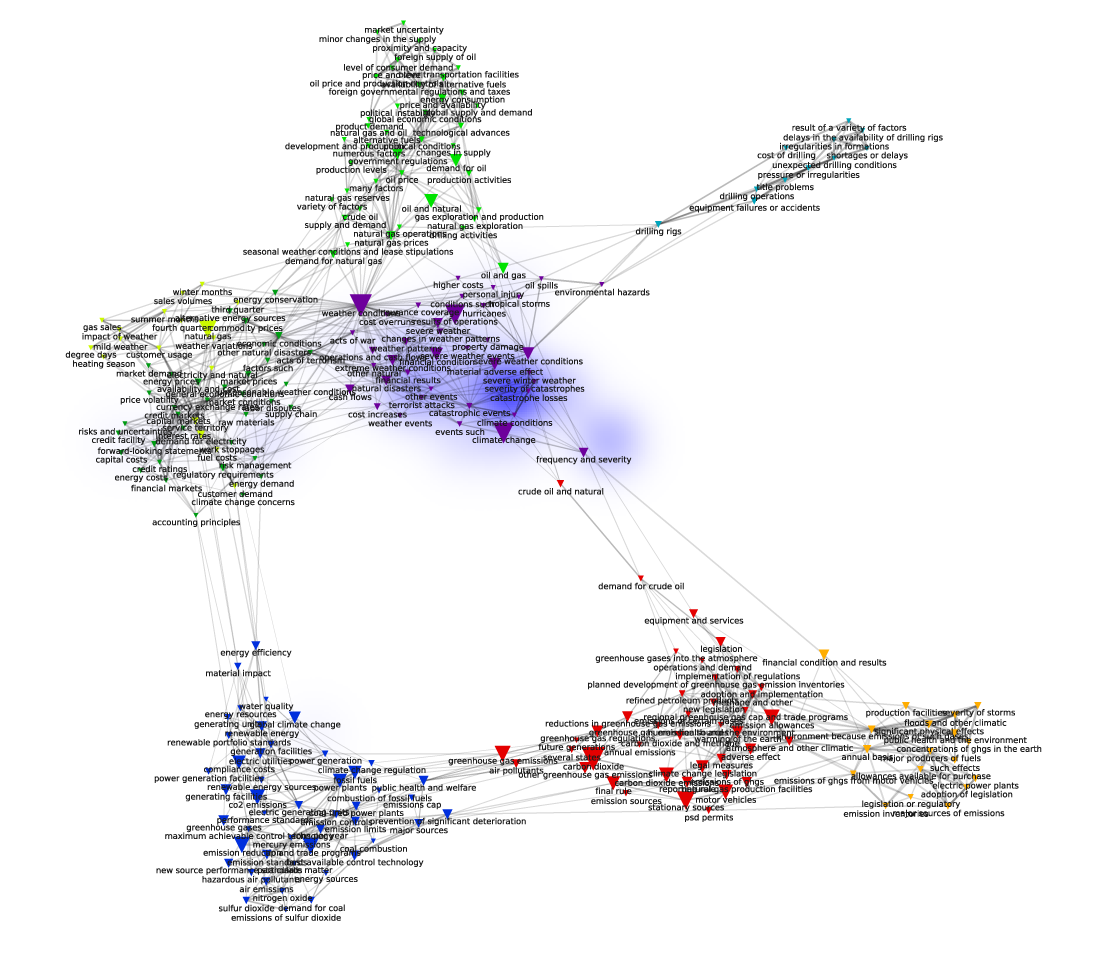
We can think of the Basemap as a structured and aggregated view of the most relevant “climate risk” terms (250 in all) found across the 6 years of our disclosure corpus. By structured, I mean that the graph measures the ecosystem of terms along three major metrics : 1) simple occurrence of terms (i.e. the number of times a term shows up in the filings); 2) co-occurence between terms in the corpus (performed by a measure of word-by-word distance within sentences and paragraphs); and 3) overall “relatedness” of a group of terms to each other (see below). By aggregated, I mean a single flat view of all 6 years of disclosure collected together in a single image.
READING THE NETWORK
The semantic analysis and spatialization platform CorText takes these three metrics and translates them into a network graph. Occurrence is represented by the SIZE of the node (or triangle) in our graph. Thus a term like “climate change” is larger than a term like “accounting principles” because it appears far more often in our sections of the 10-k filings. Co-occurence is represented by the distance of the links (often called “edges” in network analysis) between nodes. Using CorText, we parsed our terms list and traced their proximity (at the sentence and paragraph level) to other terms in the corpus, which eventually allowed us (again using clustering algorithms in CorText) to identify 8 primary “clusters” of terms — or terms that have a high-degree of relatedness in that they are found together frequently enough within disclosure reports to constitute an “issue” within the broader conversation of climate risk. We applied different colors to make these "issues" more apparent, and assigned them an overall label (such as “Regulation and Legislation” or “Natural Disaster and Severe Weather") based our overall sense of the cluster.
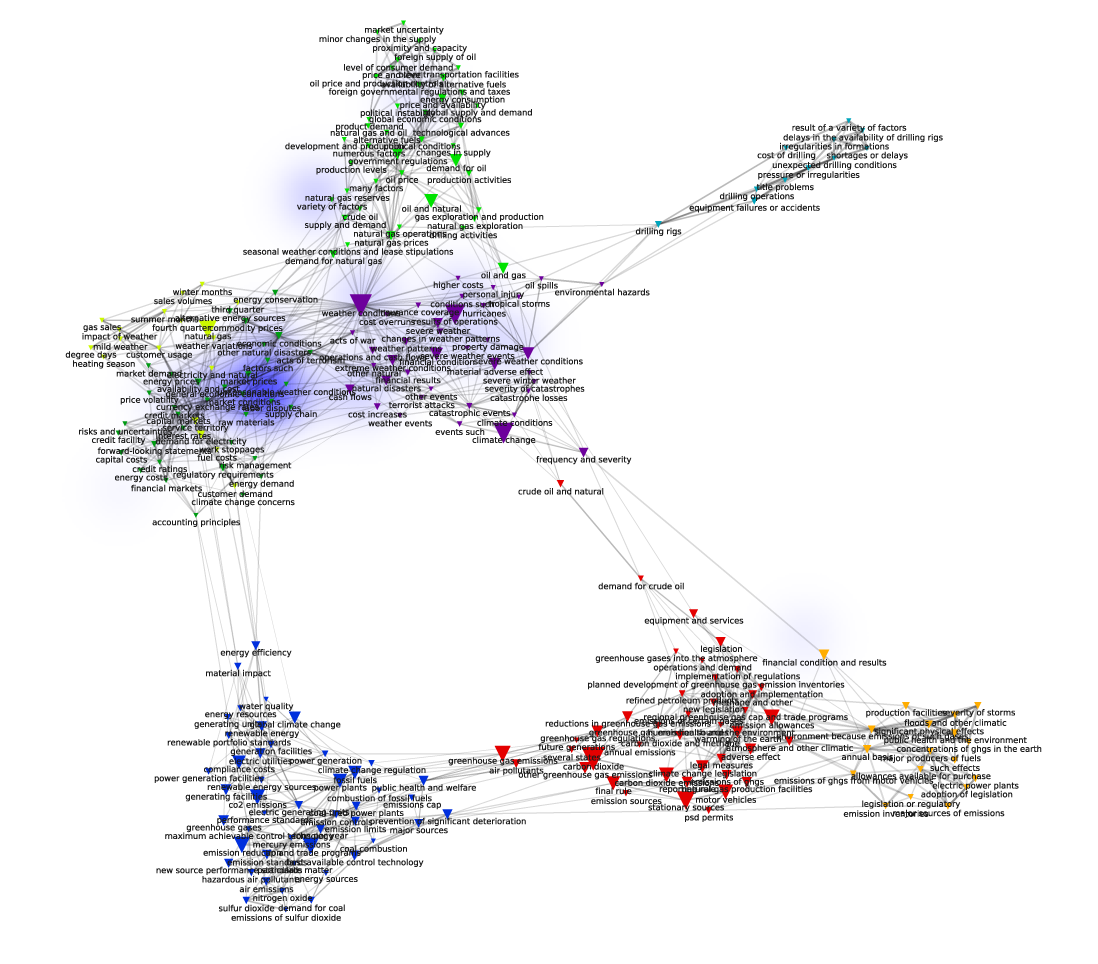
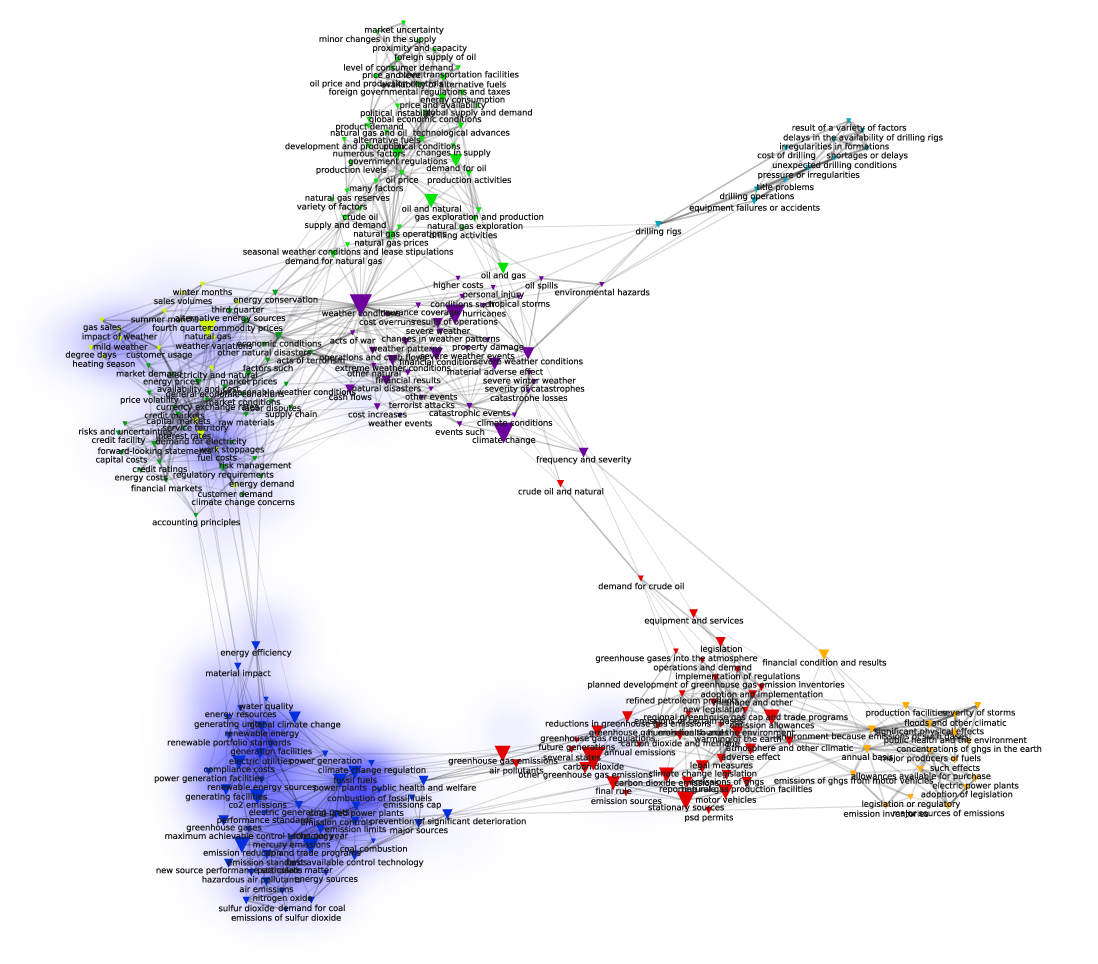
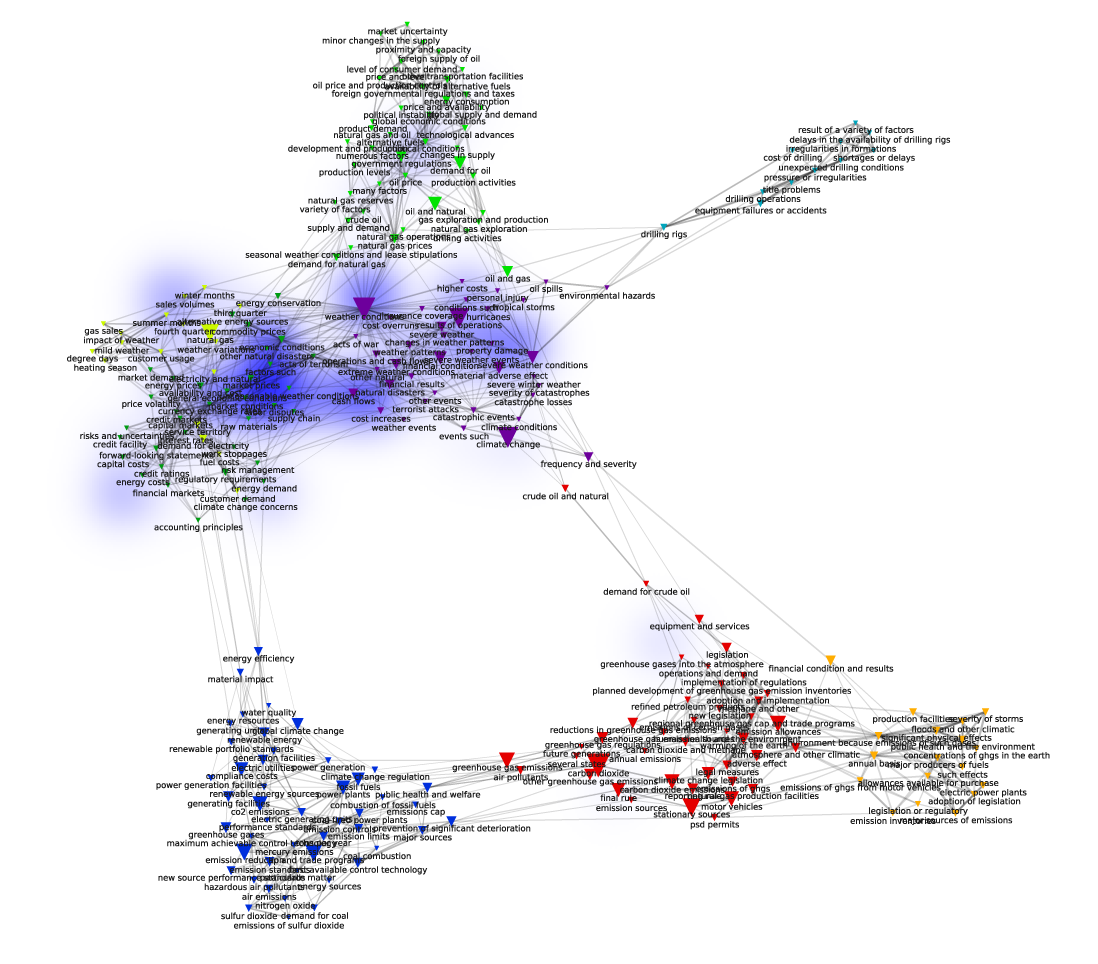
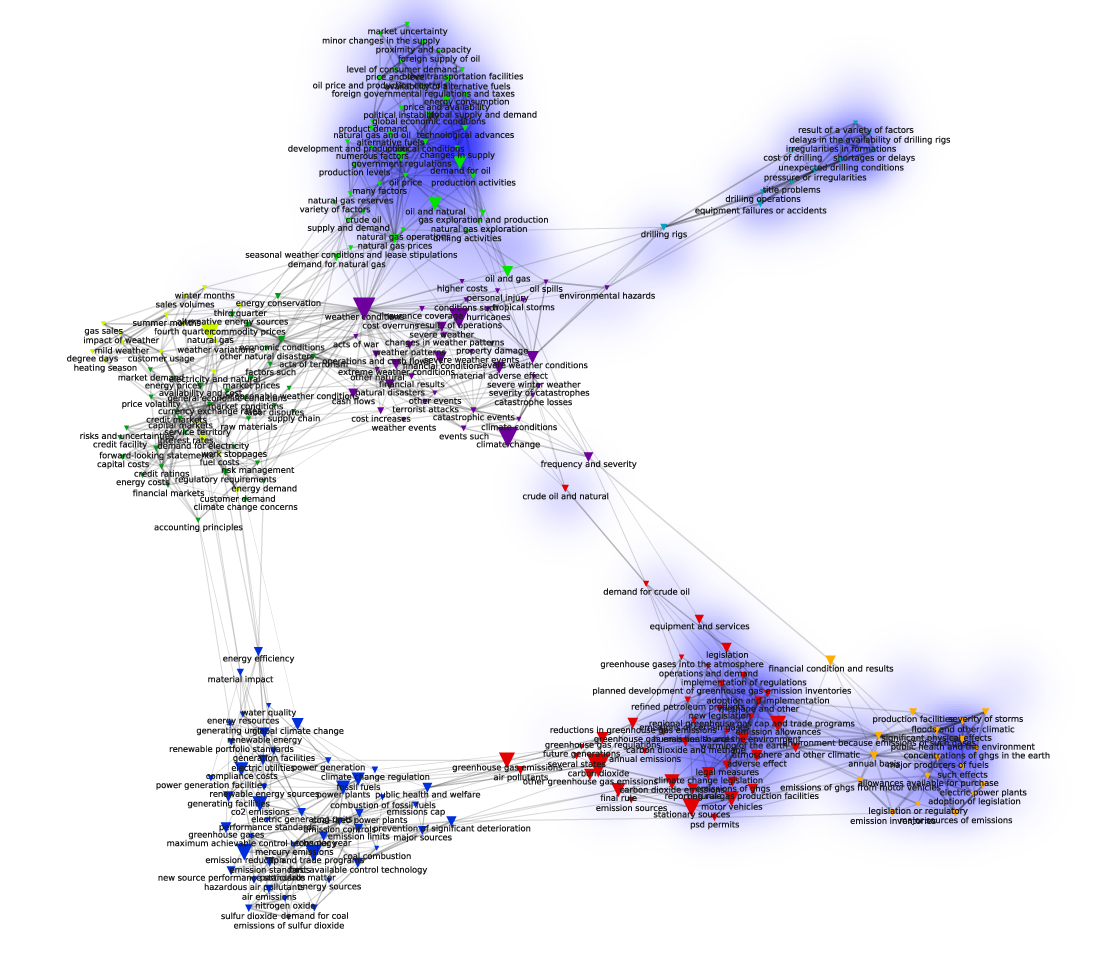
Following Leydesdorff and Rafols (2009) work of projecting an actor’s locations in a semantic graph through discreet "heatmaps", we decided to treat this set of 8 clusters as our “Basemap” of the overall conversation about climate risk between our 5 industry sectors. By clicking on the tabs with the names of the industry sectors to the right of the Basemap, you can toggle through the different “heat maps” of the industry groups. These represent the discursive signatures of each group within broader topic of climate risk.
FINDINGS
What we find is that the “issues” or clusters identified by our semantic parsing algorithms generally map discrete vocabularies. There is limited overlap between the industry sectors—they don’t share the same language of "climate risk".
The major exception are those terms found in the center of the Basemap in what we termed the “Natural Disaster and Severe Weather” cluster. Here there is a great deal of shared language between the “Apparel and Textiles”, “Food and agriculture” and “Insurance” sectors, as well as some cross-over with the “Electricity and Coal" and "Oil and Gas” sectors. This is not that surprising, since many of these weather related terms were already relevant in discussions of corporate risk. But certain terms, such as “climate change”, “changes in weather patterns”, or “frequency and severity” indicate potentially new additions to the risk language of these sectors as companies begin to assess new vulnerabilities. Detecting whether there is an increase in many of the other terms related to this issue requires both a closer reading of the filings and analysis of a larger dataset that predates the SEC’s 2010 interpretive guidance for comparison.
One other area of cross-over to highlight is between "Apparel and Textiles" and the "Food and Agriculture" sectors, particularly around terms such as “supply chain”, “raw materials” and “unseasonable weather conditions”, which point to physical risks to companies' overall business operations. Given the widespread changes in water availability, occurrence of drought, heat and pest cycles indicated by climate models, these terms may be taking into account the repercussions of this change on crop production and other raw inputs.
But overall, the industry sectors appear to be talking about their own kind of “climate risk”.
For instance, "Electricity and Coal" and "Oil and Gas”, have very little overlap with the other sectors or with each other. The most straightforward interpretation might suggest that these sectors face very different risks. The Oil and Gas sector is more threatened by questions of “methane and other”, “demand for crude”, “emissions from gig from motor vehicles”, that might stem from the risks of legislating a price on carbon. But “Electricity and Coal” companies face many of these same risks, particularly from regulation. So what we see is many groups using different language to describe similar risks. For instance, "Electricity and Coal" discuss emissions but uses terms such as “CO2 emissions”, "climate change regulation”, “cap and trade programs" and “compliance cost”, where as "Oil and Gas" uses “emissions sources”, “carbon dioxide”, “emission allowances” and “final rule”, which do not seem to show up among the terms used by “Electricity and Coal".
There is a polysemy in this conversation of climate risk along two dimensions. The first where we might consider the same term meaning different things to different actors (say "property damage” doesn’t mean the same type of risk to an insurer as it does to a oil refining company); and the second where actors use different terms to describe the same thing (as noted above). The next graph, “Terms Table” allows us to drill down deeper into each term and see these differences in usage per sector.
A final note: In terms of diversity of issues, the Oil and Gas sector occupies 4 issues of climate risk with near exclusivity — “Emission sources and Inventories”, “Regulation and Legislation”, “Extraction Operations”, and "Oil and Gas Market Drivers”. As far as “material" risk categories that companies are expected to share with investors (see the Introduction), these range from business risks (i.e. the product is at risk), to regulatory risks (legislation that might increase the cost on carbon) to physical risks (floods and climatic events). On the other hand, at least one issue appears to have little to do with “climate risk”, such as the cluster related to “drilling conditions”, which indicate risks stemming more from mechanical and physical challenges of tapping oil and gas reserves, irrespective of climate issues. There is clearly still some noise in our extractive algorithms that consisted the corpus of analysis, but it appears that our net is casting too widely, and not too narrowly.
REFERENCES
Leydesdorff, L., and Rafols, I. (2009). A global map of science based on the ISI subject categories. Journal of the American Society for Information, Science and Technology, 60(2), 348-362.